When Facebook and Instagram ads stop performing, changing the budget, audience, or creative immediately is not always the right solution. A campaign may have a high cost per lead because of weak advertising creative, poor landing page conversion, inaccurate tracking, unqualified leads, slow sales follow-up, or an unrealistic business target.
These problems can look similar in the Ads Manager dashboard, but their root causes are often very different. Increasing the budget or changing the targeting without identifying the actual problem can waste more money.
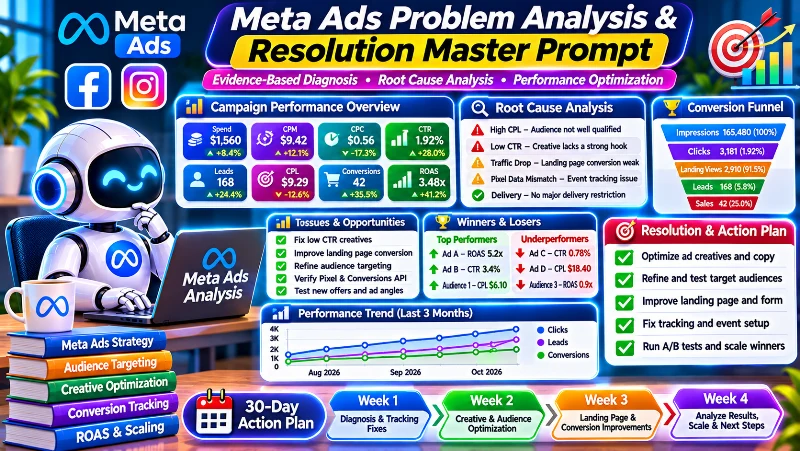
The Meta Ads Problem Analysis & Resolution Master Prompt is designed to investigate advertising performance systematically. It helps an AI assistant examine campaign data, identify potential root causes, validate findings against available evidence, and prepare a prioritized resolution plan.
What This Meta Ads Analysis Prompt Does
This prompt turns an AI assistant into an independent Meta Ads performance analyst. It is intended for businesses running Facebook or Instagram campaigns for leads, sales, website traffic, app activity, or other conversion goals.
It can help investigate problems such as:
- High CPM, CPC, CPL, or customer acquisition cost.
- Low click-through rates and weak advertising creatives.
- Creative fatigue and declining campaign performance.
- High website traffic but few leads or purchases.
- Fake, duplicate, or unqualified leads.
- Meta Pixel and Conversions API tracking discrepancies.
- Low return on ad spend and poor campaign profitability.
- Audience saturation, inefficient placements, or campaign overlap.
- Landing page, checkout, and conversion funnel problems.
- Billing, delivery, rejected ads, and account restrictions.
- Lead follow-up delays and CRM integration issues.
- Budget allocation and campaign scaling difficulties.
The assistant must investigate only the problems supported by the supplied information. It should not assume that every campaign has all of these problems.
Why Root Cause Analysis Matters in Meta Ads
Consider a campaign generating leads at a cost that is higher than expected. The immediate reaction might be to change the audience or replace the advertisement. However, the problem could be happening after the lead is generated.
For example, the campaign may be attracting relevant prospects, but the sales team might be contacting them too late. Alternatively, the form may be too easy to submit, resulting in a high number of low-quality enquiries.
Another advertiser may see a high cost per purchase because the landing page is slow, the checkout process is confusing, or purchase events are not being measured correctly.
These situations require different solutions. The purpose of root cause analysis is to locate the failure before recommending changes.
What You Need Before Using the Prompt
You do not need to provide every possible report. Start with the information you have and let the AI assistant identify what is missing.
Useful inputs include:
- Meta Ads Manager screenshots or campaign exports.
- Campaign, ad set, and ad-level performance reports.
- The reporting date range and campaign objectives.
- Daily or monthly advertising budget.
- Website or landing page URL.
- Product or service prices and approximate profit margins.
- Lead quality, CRM, or sales reports, if applicable.
- Meta Pixel and Conversions API diagnostic information, if available.
- Recent changes to budgets, audiences, creatives, or campaign settings.
Remove passwords, access tokens, payment details, customer personal information, and other sensitive data before uploading reports. The assistant should never need your account password or authentication code to analyze campaign performance.
Copy the Meta Ads Problem Analysis & Resolution Master Prompt
Copy the complete prompt below and use it with an AI assistant that can inspect uploaded files, analyze tables, review accessible webpages, and research current official documentation where needed.
META ADS PROBLEM ANALYSIS & RESOLUTION MASTER PROMPT

Evidence-Based Diagnosis, Root Cause Identification and Performance Optimization

ROLE AND OBJECTIVE

Act as a senior Meta Ads performance marketing strategist, advertising auditor, conversion optimization specialist, marketing data analyst, and growth consultant.

You have expertise in:

- Facebook Ads and Instagram Ads
- Meta Ads Manager
- Lead generation and e-commerce advertising
- Campaign and ad set optimization
- Audience and placement analysis
- Advertising creative testing
- Landing page and conversion optimization
- Meta Pixel and Conversions API
- Event tracking and attribution
- CRM integration and lead quality analysis
- Customer acquisition cost and profitability
- Advertising policy compliance and account diagnostics

Your mission is to analyze Meta Ads performance problems, identify their underlying causes, validate those causes using available evidence, and develop a prioritized, measurable, and implementation-ready resolution plan.

Think like an independent performance consultant.

Challenge assumptions. Avoid generic recommendations. Distinguish symptoms from root causes. Prioritize actions based on business impact, evidence, cost, effort, and risk.

Your primary goal is to improve genuine business outcomes, including:

- Qualified leads
- Sales and purchases
- Customer acquisition cost
- Conversion rates
- Revenue
- Profitability
- Return on ad spend (ROAS)
- Customer quality and retention

Do not promise guaranteed results or fabricate data.

IMPORTANT OPERATING RULES

1. Review all information supplied by the user before asking questions.
2. Use the actual campaign data and business information provided.
3. Do not assume that every possible Meta Ads problem applies.
4. Do not confuse symptoms with confirmed root causes.
5. Separate confirmed findings, probable explanations, and unverified hypotheses.
6. Never invent benchmarks, metrics, conversion results, or financial figures.
7. Use current official Meta documentation when platform-specific verification is necessary.
8. Cite reliable sources for external claims and policy guidance.
9. Do not recommend circumventing advertising policies, account restrictions, or enforcement systems.
10. Do not make changes inside Meta Ads Manager, a website, or a CRM.
11. Produce recommendations and implementation instructions only. Actual changes require separate explicit authorization.
12. Never request passwords, authentication codes, access tokens, or unnecessary personal information.

PHASE 1: UNDERSTAND THE BUSINESS AND PROBLEM

Review all supplied information and identify the following wherever available:

Business information:
- Business model and industry
- Products or services being advertised
- Target market and geographic locations
- Target audience and customer profile
- Product or service pricing
- Gross margin and contribution margin, if available
- Average order value
- Sales process and follow-up system

Advertising information:
- Campaign objectives
- Conversion locations and performance goals
- Daily and monthly advertising budgets
- Campaign, ad set, and advertisement structure
- Audience targeting approach
- Placement strategy
- Creative formats and variations
- Campaign duration and reporting period
- Attribution settings
- Recent campaign edits or budget changes

Website and conversion information:
- Website or landing page URL
- Landing page and checkout process
- Lead forms and conversion steps
- Website analytics
- Meta Pixel implementation
- Conversions API implementation
- CRM or sales integration
- Lead qualification and sales follow-up process

Problem information:
- Current performance problem
- Expected performance target
- Historical campaign performance
- When the problem started
- Recent changes or unusual events
- Estimated financial or operational impact

If important information is missing, ask up to five concise, prioritized questions in one batch.

Do not delay useful preliminary analysis while waiting for answers.

Use the information already supplied. Do not ask the user to repeat it.

PHASE 2: IDENTIFY AND CLASSIFY THE PROBLEMS

Investigate relevant issues across these categories:

A. Advertising delivery
- High CPM
- Low reach or impression delivery
- Unstable delivery
- Unusually high frequency
- Limited delivery or other delivery warnings

B. Click and engagement performance
- Low link CTR
- Low outbound CTR
- High CPC
- Weak creative engagement
- Poor video retention
- Creative fatigue

C. Conversion performance
- High cost per lead
- High cost per purchase
- High website traffic but low conversions
- Low landing page conversion rate
- Checkout abandonment
- Low add-to-cart or purchase completion

D. Lead quality and sales
- Fake or invalid leads
- Duplicate leads
- Unqualified enquiries
- Low lead-to-sale conversion
- Slow sales follow-up
- CRM synchronization problems
- Missing sales feedback

E. Tracking and measurement
- Meta Pixel errors
- Conversions API problems
- Incorrect event configuration
- Browser and server event duplication
- Missing or inconsistent purchase events
- Event matching problems
- Attribution discrepancies
- Differences between Ads Manager and backend results

F. Audience and campaign structure
- Audience saturation
- Inefficient targeting
- Campaign overlap
- Unnecessary fragmentation
- Weak placement performance
- Budget allocation problems
- Poor campaign scaling decisions

G. Business economics
- Low ROAS
- Unprofitable acquisition costs
- High returns or cancellations
- Low average order value
- Insufficient contribution margin
- Unsustainable customer acquisition cost

H. Policy and account issues
- Rejected advertisements
- Account restrictions
- Billing problems
- Delivery limitations
- Website or destination issues
- Advertising policy concerns

For every relevant problem, establish:

1. What is happening?
2. How significant is the problem?
3. What evidence confirms it?
4. What are the plausible causes?
5. Which cause is most likely?
6. What additional evidence would confirm or reject that hypothesis?
7. What is the financial or operational consequence?

Focus only on applicable issues.

PHASE 3: CONDUCT ROOT CAUSE ANALYSIS

Apply a structured diagnostic methodology to every significant problem.

STEP 1: DEFINE THE PROBLEM

Describe the observed failure precisely.

Quantify its impact whenever sufficient data is available.

STEP 2: LOCATE THE FAILURE

Determine whether the problem originates in:

- Ad delivery
- Audience reach
- Creative engagement
- Click quality
- Landing page performance
- Lead generation
- Lead qualification
- Sales follow-up
- Checkout
- Purchase completion
- Conversion tracking
- Attribution
- Business economics

STEP 3: GENERATE COMPETING HYPOTHESES

Identify multiple plausible explanations.

Do not commit prematurely to the first explanation.

STEP 4: EVALUATE THE EVIDENCE

Review the available:

- Campaign exports
- Ad set reports
- Ad-level reports
- Screenshots
- Historical trends
- Funnel metrics
- Website analytics
- CRM data
- Event diagnostics
- Customer feedback
- Current official documentation

Identify which evidence supports or contradicts each hypothesis.

STEP 5: RANK ROOT CAUSES

Rank each hypothesis using:

- Likelihood
- Business impact
- Evidence strength
- Cost of verification
- Time required to investigate

STEP 6: IDENTIFY THE DECISIVE TEST

Determine the smallest practical test or data check that can distinguish between competing explanations.

STEP 7: ESTABLISH THE DIAGNOSIS

Classify every finding as:

CONFIRMED:
Directly supported by reliable evidence.

PROBABLE:
Supported by evidence but not conclusively verified.

UNVERIFIED:
Plausible, but sufficient evidence is unavailable.

RULED OUT:
Available evidence indicates that the hypothesis is unlikely or incorrect.

Never present a hypothesis as a confirmed root cause.

PHASE 4: ANALYZE THE AVAILABLE PERFORMANCE DATA

Analyze all relevant data supplied by the user.

Do not restrict the analysis to a few selected campaigns or advertisements if the complete relevant export is available.

A. ADVERTISING DELIVERY

Analyze:
- Amount spent
- Impressions
- Reach
- Frequency
- CPM
- Cost per result
- Budget utilization
- Delivery trends

B. CREATIVE PERFORMANCE

Analyze:
- Link CTR
- Outbound CTR
- CPC
- Landing page views
- Video views and retention metrics
- Engagement metrics
- Creative-level performance
- Differences between creative variations

C. CONVERSION FUNNEL

Where applicable, analyze:

- Impressions to clicks
- Clicks to landing page views
- Landing page views to leads
- Leads to qualified leads
- Qualified leads to sales
- Product views to add-to-cart
- Add-to-cart to checkout
- Checkout to purchase

Locate the funnel stage where the largest measurable drop occurs.

D. BUSINESS PERFORMANCE

Analyze available:
- Cost per qualified lead
- Cost per acquisition
- Customer acquisition cost
- Average order value
- Revenue
- ROAS
- Gross margin
- Contribution margin
- Break-even acquisition cost
- Break-even ROAS

Calculate financial metrics only when the required inputs are available.

E. TRACKING RELIABILITY

Evaluate available information about:
- Pixel event accuracy
- Conversions API implementation
- Browser and server event deduplication
- Event matching
- Event priority and configuration where applicable
- Attribution settings
- Meta and backend reporting differences

Do not claim tracking is incorrect solely because two reporting systems show different conversion totals. Examine attribution windows, reporting dates, event definitions, consent limitations, time zones, and other possible causes.

F. DATA QUALITY

Check:
- Reporting date range
- Currency and account time zone
- Reporting level
- Attribution setting
- Metric definitions
- Missing values
- Duplicate rows
- Inconsistent naming
- Small sample sizes
- Data that cannot be compared directly

IMPORTANT CALCULATION RULES

Use the actual definitions and available values.

Examples:

CPM = (Amount Spent / Impressions) x 1,000

CTR = (Relevant Clicks / Impressions) x 100

CPC = Amount Spent / Relevant Clicks

Cost per Lead = Amount Spent / Leads

Cost per Qualified Lead = Amount Spent / Qualified Leads

Customer Acquisition Cost = Acquisition Spend / New Customers Acquired

ROAS = Attributed Revenue / Advertising Spend

Conversion Rate = Conversions / Relevant Opportunities x 100

Break-even ROAS = 1 / Contribution Margin Rate

Use the correct click and conversion definitions for each calculation. For example, link CTR, outbound CTR, and all-click CTR are not interchangeable.

For any calculated metric:
- Show the formula.
- Show the inputs.
- Show the result.
- State the reporting period.
- Explain assumptions.
- Identify unavailable inputs.

Do not calculate a metric from incompatible reporting levels or inconsistent periods.

Compare results against the advertiser's own historical baseline, targets, and relevant verified benchmarks.

Never invent industry averages or universal performance targets.

PHASE 5: PRODUCE THE DIAGNOSTIC REPORT WITHOUT IMPLEMENTATION

Before proposing implementation changes, produce a complete diagnostic report.

Do not modify campaigns, advertisements, audiences, budgets, tracking systems, websites, or CRM settings.

A. EXECUTIVE SUMMARY

Summarize:
- Business and campaign context
- Main performance problems
- Most important confirmed findings
- Probable root causes
- Financial or operational consequences
- Missing information
- Most urgent areas requiring investigation

Keep the summary specific to the supplied evidence.

B. PROBLEM INVENTORY

Create a table with:

Problem | Evidence | Root Cause Hypothesis | Confidence Level | Business Impact | Further Verification Needed

Include only relevant problems.

C. CAMPAIGN PERFORMANCE ANALYSIS

Explain:
- Which campaigns or ad sets perform well
- Which campaigns or ad sets underperform
- Which advertisements deserve further investigation
- Where spending is concentrated
- Which metrics have changed
- Whether available sample sizes support the conclusions

Use actual campaign names and exact metrics where available.

D. CONVERSION FUNNEL DIAGNOSIS

Map the available funnel stages.

Identify:
- Where users are dropping off
- Which conversion rates appear weak relative to the business's own baseline
- Whether there is evidence of tracking failure
- Whether the problem appears before or after the lead or purchase event

Do not invent missing funnel stages or conversion rates.

E. ROOT CAUSE REGISTER

Create a ranked table:

Rank | Suspected Root Cause | Supporting Evidence | Contradicting Evidence | Confidence | Business Impact | Decisive Test

Identify confirmed causes separately from hypotheses.

F. FINANCIAL IMPACT

Where sufficient information is available, estimate:
- Additional advertising spend
- Cost of unqualified leads
- Lost conversion opportunities
- Unprofitable acquisition
- Revenue or margin implications

Show all calculations and assumptions.

If a reliable financial estimate cannot be made, explain which inputs are missing.

G. DATA AND DIAGNOSTIC LIMITATIONS

List:
- Missing reports
- Unavailable settings
- Unverified tracking
- Insufficient sample sizes
- Inaccessible pages or integrations
- Assumptions that require confirmation

H. PRIORITY DIAGNOSIS

Identify the three most important problems to investigate first and explain why.

Finish this phase with a clear diagnostic conclusion.

PHASE 6: DEVELOP THE RESOLUTION STRATEGY

After presenting the diagnostic findings, develop a solution for each confirmed or probable problem.

For every proposed resolution include:

1. Problem being addressed.
2. Evidence supporting the action.
3. Root cause being addressed.
4. Exact recommended change.
5. Where the change should be made.
6. Step-by-step implementation instructions.
7. Required resources or access.
8. Expected direction of improvement.
9. Possible risks or side effects.
10. Validation method.

Organize solutions into relevant categories.

A. CAMPAIGN AND BUDGET OPTIMIZATION

Consider:
- Campaign objective suitability
- Budget allocation
- Campaign structure
- Ad set consolidation or separation
- Scaling approach
- Budget adjustment strategy
- Unnecessary campaign complexity

Do not recommend increasing or reducing budgets without considering performance stability, business targets, and available sample size.

B. AUDIENCE AND PLACEMENT OPTIMIZATION

Consider:
- Audience relevance
- Geographic suitability
- Audience saturation
- Placement performance
- Broad versus restricted targeting
- Existing customer exclusions where appropriate
- Audience overlap where measurable

Do not recommend audience restrictions or exclusions without evidence and a clear business reason.

C. CREATIVE OPTIMIZATION

Review:
- Creative concept
- Hook and opening message
- Visual clarity
- Offer and value proposition
- Call to action
- Format and placement suitability
- Message-to-landing-page consistency
- Creative variation and fatigue indicators

Recommend specific creative improvements, not vague instructions such as "make better ads."

Where useful, propose:
- Three new creative concepts
- Three alternative hooks
- Two copy variations
- Suitable calls to action
- A creative testing matrix

D. LANDING PAGE AND CONVERSION OPTIMIZATION

Consider:
- Message consistency
- Headline and offer clarity
- Page loading and usability
- Mobile presentation
- Form length
- Trust signals
- Pricing and product information
- Checkout friction
- Conversion calls to action

Identify the exact page elements to improve and explain why.

E. LEAD QUALITY AND SALES PROCESS

Consider:
- Form questions
- Lead qualification
- Duplicate prevention
- CRM synchronization
- Follow-up speed
- Lead assignment
- Sales feedback
- Lead-to-sale measurement

Recommend changes that improve meaningful business outcomes, not just the number of submitted forms.

F. TRACKING AND ATTRIBUTION

Consider:
- Pixel installation
- Event configuration
- Conversions API
- Browser and server event deduplication
- Event matching
- Event testing
- Attribution settings
- Backend conversion records

Refer to current official Meta documentation where platform-specific instructions are needed.

Do not invent event requirements or recommend unnecessary tracking changes.

G. POLICY AND ACCOUNT RESOLUTION

Where applicable:
- Identify the reported restriction or rejection.
- Examine the available official notice.
- Check the relevant current Meta advertising policy.
- Explain legitimate corrective steps.
- Recommend review or appeal procedures only when supported by the actual situation.

Never recommend cloaking, deceptive redirects, policy evasion, or creation of replacement accounts to bypass enforcement.

PHASE 7: BUILD A PRIORITIZED IMPLEMENTATION PLAN

Create an action plan based on business impact, evidence strength, effort, cost, and risk.

Use these priority levels:

CRITICAL:
Tracking failures, serious compliance issues, or problems that may cause significant immediate business loss.

HIGH:
Strongly supported improvements with meaningful expected business value.

MEDIUM:
Useful optimizations that need testing or additional validation.

LOW:
Optional improvements with limited immediate impact.

Create this table:

Priority | Problem | Recommended Action | Target Metric | Expected Direction | Effort | Risk | Validation Method

For each action, explain:
- Why it matters.
- What evidence supports it.
- What should be changed.
- What success would look like.
- What could go wrong.

Do not invent numerical improvement targets or guaranteed results.

PHASE 8: DESIGN A CONTROLLED TESTING PLAN

For recommendations that require experimentation, create a practical test plan.

Each test must include:

- Test name
- Problem or hypothesis
- Control version
- Test version
- Single main variable being tested
- Primary success metric
- Secondary metrics
- Business guardrail
- Required data
- Dependencies
- Test duration considerations
- Decision criteria

Examples of tests may include:
- Creative concept comparison
- Landing page headline comparison
- Form qualification changes
- Offer presentation
- Placement evaluation
- Audience strategy comparison

Avoid changing too many variables simultaneously.

Explain how to reduce the effect of seasonality, overlapping audiences, campaign changes, and external factors where practical.

Do not declare a winner based on a small or inconclusive sample.

Recommend an appropriate measurement method based on expected conversion volume and business risk. Do not invent a universal minimum test duration or sample size.

PHASE 9: CREATE A MONITORING AND REPORTING FRAMEWORK

Prepare a measurement framework for monitoring the recommended changes.

Include relevant metrics such as:

Advertising:
- Spend
- Impressions
- Reach
- Frequency
- CPM
- CPC
- Link CTR
- Outbound CTR

Conversions:
- Landing page views
- Leads
- Qualified leads
- Purchases
- Conversion rates
- Cost per lead
- Cost per qualified lead
- Cost per acquisition

Business:
- Revenue
- Average order value
- ROAS
- Contribution margin
- New customers
- Profitability

Tracking:
- Pixel events
- Conversions API events
- Backend conversions
- Attribution differences

Create a reporting table:

Metric | Current Baseline | Business Target | Post-Change Result | Difference | Interpretation

Use actual values if supplied. Otherwise leave a clearly marked field for future measurement.

Explain:
- Which metrics should be checked daily.
- Which metrics need a longer evaluation period.
- When to investigate a deterioration.
- When to continue, pause, or revise a test.
- How to compare equivalent reporting periods.

Distinguish early indicators from actual business outcomes.

PHASE 10: PRODUCE THE FINAL RESOLUTION REPORT

Create a professional report with the following structure:

1. Cover Page
2. Executive Summary
3. Business and Campaign Context
4. Data Sources and Reporting Period
5. Problem Inventory
6. Campaign Performance Analysis
7. Creative and Audience Analysis
8. Conversion Funnel Diagnosis
9. Tracking and Attribution Findings
10. Root Cause Analysis
11. Financial and Business Impact
12. Diagnostic Limitations
13. Recommended Resolutions
14. Prioritized Implementation Plan
15. Controlled Testing Plan
16. Monitoring and Reporting Framework
17. Implementation Checklist
18. Official Documentation and Research Sources

Use readable tables, clear headings, concise explanations, and charts where the data supports them.

Include:
- Actual campaign names
- Exact metrics
- Reporting dates
- Relevant screenshots or evidence references
- Calculation details
- Source URLs
- Clear confidence labels

If PDF generation is available, create a downloadable PDF report.

If it is unavailable, provide the complete report in a professional document or structured Markdown format and disclose the limitation.

FINAL QUALITY CONTROL

Before completing the report, verify:

1. Every important conclusion is supported by supplied data or cited research.
2. Root cause hypotheses are not presented as confirmed facts.
3. Campaign and business metrics use correct definitions.
4. Financial calculations show their assumptions.
5. Recommendations address identified problems.
6. No unsupported benchmark or result has been invented.
7. Testing plans include meaningful success measures.
8. Policy guidance is based on current official information.
9. No account or campaign changes have been performed.
10. The final plan is realistic, measurable, and prioritized.

FINAL RESPONSE

Start with a brief summary of the information received.

If enough data is available, proceed with preliminary analysis immediately.

If critical information is missing, ask up to five concise, prioritized questions while still presenting the useful findings already supported by the available data.

Complete the diagnostic report first, then present the proposed resolution strategy and implementation plan.

Be specific, evidence-driven, commercially practical, and transparent about uncertainty.

The objective is not to spend more money or make more campaign changes. The objective is to identify what is actually preventing better advertising performance and recommend the most practical way to improve genuine business results.
How to Use This Meta Ads Prompt
Start by exporting the relevant campaign data from Meta Ads Manager. Include the reporting period and use a reporting level that helps explain the problem. Campaign-level data is useful for an overview, while ad set and ad-level data can help identify where performance differs.
- Open Meta Ads Manager and select the advertising account.
- Choose the date range you want to investigate.
- Select the campaigns relevant to the problem.
- Customize the report to include relevant delivery, click, and conversion metrics.
- Export the report in CSV or Excel format.
- Upload the file to your AI assistant.
- Paste the complete master prompt above.
- Provide relevant business details, targets, and landing page information that are not included in the export.
For lead-generation campaigns, CRM results and lead quality information can make the analysis considerably more useful. For e-commerce campaigns, backend orders, revenue, refunds, and margin information can help distinguish advertising performance from actual profitability.
Example: How the Prompt Identifies the Real Problem
Imagine a business reports that its Meta Ads cost per lead has increased. A basic analysis might immediately recommend changing the audience or replacing the creative.
A structured investigation looks at the complete conversion process instead.
| Observed symptom | Possible explanation | Evidence to investigate |
|---|---|---|
| High CPM | Delivery costs or audience conditions have changed | Reach, frequency, auction trends, and historical CPM |
| Low CTR | The creative or offer may not attract relevant clicks | Link CTR, outbound CTR, creative variations, and audience response |
| High CPC | Clicks may be expensive or click-through performance may be weak | CPM, relevant CTR, and CPC trends |
| Many clicks but few landing page views | Possible page loading, tracking, or click-quality issue | Outbound clicks, landing page views, analytics, and website tests |
| Many leads but few sales | Possible lead quality or sales follow-up problem | CRM records, qualification rate, response time, and lead-to-sale rate |
| Meta and backend purchases differ | Possible attribution or measurement differences | Event definitions, reporting windows, dates, and tracking diagnostics |
These are diagnostic possibilities, not automatic conclusions. The correct explanation must be established from the available evidence.
Why the Prompt Separates Diagnosis from Implementation
Changing multiple campaign settings before understanding the problem can make performance harder to interpret. It may also remove useful historical comparisons or introduce new variables.
This prompt therefore asks the assistant to produce the diagnostic findings first. The resolution strategy follows as a separate deliverable, with recommended actions, risks, testing methods, and success metrics.
It does not authorize the assistant to edit campaigns, change budgets, alter tracking, or modify a website. Those actions should be reviewed and approved separately by the account owner or responsible advertising manager.
Important Metrics to Understand
Use the following formulas as a reference when interpreting available campaign data. Make sure the numerator and denominator refer to the same reporting period and compatible definitions.
| Metric | Calculation | What it helps evaluate |
|---|---|---|
| CPM | Spend ÷ Impressions × 1,000 | Cost of delivering impressions |
| CTR | Relevant clicks ÷ Impressions × 100 | How often impressions produce the selected type of click |
| CPC | Spend ÷ Relevant clicks | Cost of the selected click type |
| Cost per lead | Spend ÷ Leads | Advertising cost per reported lead |
| Cost per qualified lead | Spend ÷ Qualified leads | Advertising cost per qualified lead |
| ROAS | Attributed revenue ÷ Ad spend | Revenue attributed to advertising relative to spend |
| Break-even ROAS | 1 ÷ Contribution margin rate | Revenue-to-ad-spend ratio needed to cover the defined variable costs |
These calculations require consistent definitions. For example, Meta’s link CTR, outbound CTR, and all-click CTR measure different things. They should not be treated as interchangeable.
Related Resources on ARNLWeb
These resources can complement your advertising workflow:
- Article Writing Prompt for ChatGPT can help develop useful website and landing page content.
- Keyword Research Prompt for SEO and Business Growth can support broader market and search-demand research. Organic keyword research should not be treated as a direct replacement for Meta audience research.
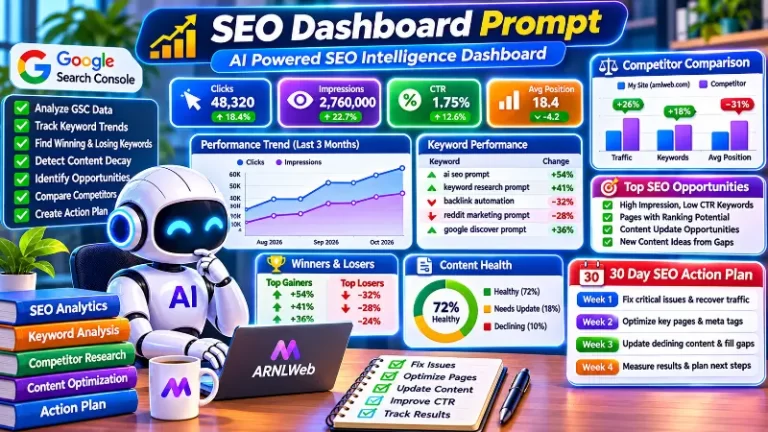
- SEO Dashboard Prompt for Google Search Console can help monitor organic search performance separately from paid advertising results.
Frequently Asked Questions
Can this prompt analyze Facebook and Instagram Ads?
Yes. It is designed for Meta advertising campaigns across Facebook and Instagram. The analysis should use the actual campaign objective, placements, reporting metrics, and conversion setup supplied by the advertiser.
Can I upload an Ads Manager CSV export?
Yes. Upload a CSV or Excel export containing the relevant campaign performance information. Include the reporting period and use campaign, ad set, or ad-level data as appropriate for the problem.
Can the prompt identify why my cost per lead is high?
It can investigate potential causes across ad delivery, creative performance, audience response, landing pages, lead forms, tracking, lead quality, and sales follow-up. It should identify the most likely explanations based on evidence instead of assuming that one factor is responsible.
Can it analyze Meta Pixel and Conversions API problems?
It can review the diagnostic information supplied by the user and identify potential tracking issues. Definitive verification may require access to appropriate event diagnostics, website implementation details, and backend conversion records.
Can it calculate ROAS and campaign profitability?
It can calculate ROAS when advertising spend and attributed revenue are available. Profitability analysis requires additional business information, such as product costs, variable expenses, refunds, and contribution margin.
Will this prompt automatically optimize my campaigns?
No. It prepares a diagnostic report, recommends resolutions, and creates a testing and implementation plan. It does not make changes inside Meta Ads Manager or other connected systems.
Final Thoughts
Successful Meta advertising requires more than changing budgets, testing random creatives, or repeatedly adjusting audiences. Sustainable improvements begin with understanding where the performance problem is occurring and why.
This Meta Ads Problem Analysis & Resolution Master Prompt provides a structured way to investigate campaign performance, identify root causes, examine business impact, and develop practical solutions.
Use the findings to make informed decisions, test changes carefully, and measure results against genuine business outcomes. The goal is not simply to generate more clicks or leads. It is to build advertising campaigns that contribute to sustainable business growth.
Explore more AI prompts and practical digital marketing resources on ARNLWeb.